Departments allow you to segment your books to track performance across teams, service lines, or business units.
Step 1: Set up your Departments
Go to Accounting > Departments in the left-hand menu.
Click Add Department to create one manually.
(Optional) If your client is connected to QuickBooks Online (QBO), click Import Departments to bring in your existing structure.
Organize departments into a hierarchy as needed — for example: Sales > East Coast.
⚠️ You won’t see the import option unless your firm is connected to QBO.
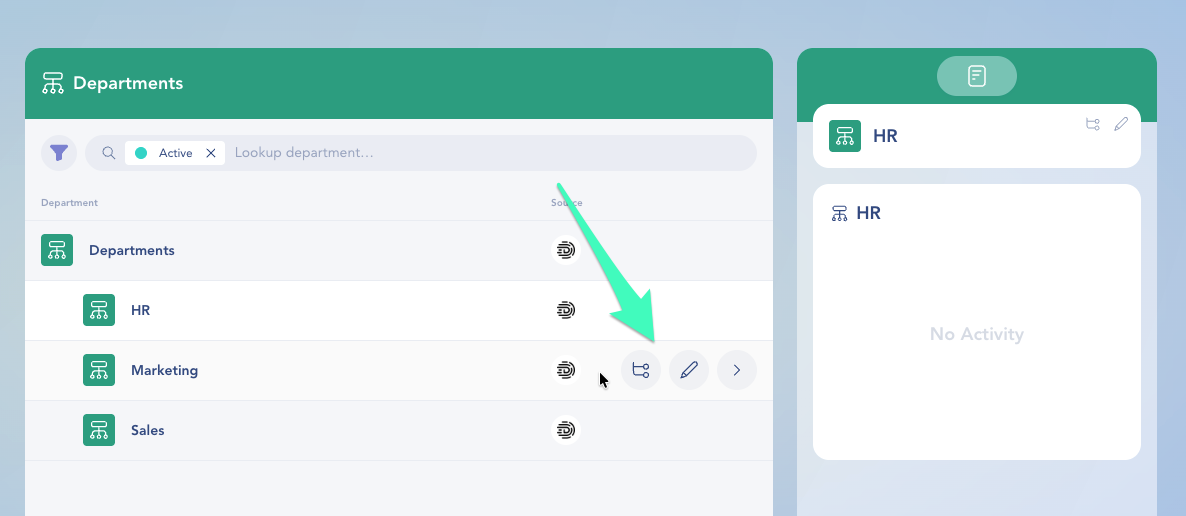
To make changes, hover over a department name to:
Click the Pencil to rename or modify the department. (Note: editing is not available for departments imported from QBO or Gusto.)
Click the Hierarchy icon to add a child department.
Step 2: Tag transactions with a Department
Once your departments are set up, you can start tagging transactions.
To tag one transaction:
Go to Ledger.
Click into a transaction.
Click Edit at the top.
Use the Department field to assign a tag.
To tag one or more transactions at once:
In the Ledger, click Edit at the top.
Check the boxes next to the transactions you want to tag.
Click the Department icon in the toolbar at the top.
Select the department from the dropdown.
Click Apply to save your changes.
Tip: Unsure about the right department? You can leave a comment or question on any transaction to confirm with a teammate or client.
Step 3: Report by Department
After transactions are tagged, you can view department-level reporting.
To view Profit & Loss by Department:
Go to Custom Reports > Profit & Loss.
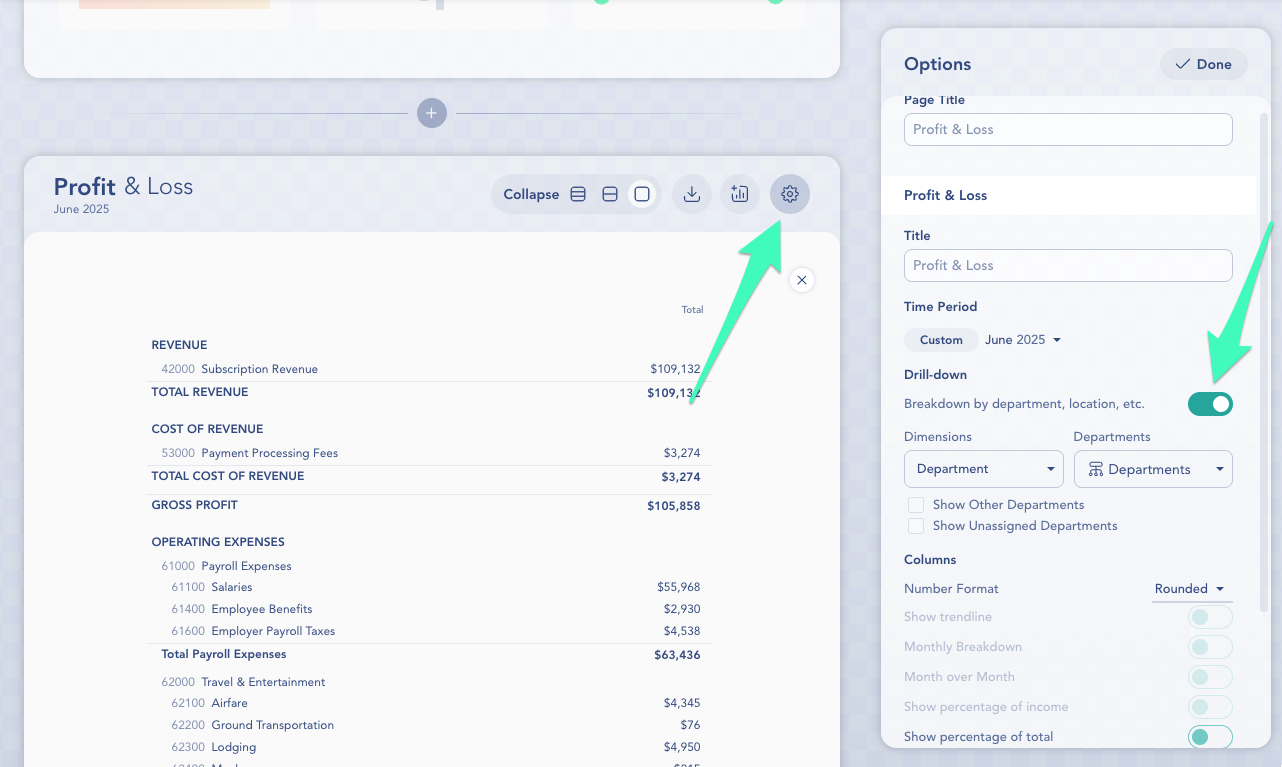
Click the gear icon in the upper right of the report.
Toggle on Drill-down to enable department (and location) breakdown.
Under Dimensions, select Department, then choose one or more from the dropdown.
This lets you filter and break down P&L reports to compare revenue and expenses across departments.
You can also add department-specific widgets to Reports:
Go to any Custom Report (like Executive Summary).
Click Options at the top of the report.
Select the Department tab in the Add Graphs panel.
Choose from available department-based graphs — including category-level breakdowns.
Add your desired widget(s), then click Done.
To add department charts to your Dashboard:
Go to Home.
Click Edit in the top-right corner.
Click the Department icon in the chart selector panel.
You’ll see available charts for each department.
Drag and drop the ones you want onto your dashboard.
Click Done to save your changes.
Need help setting up or using Departments? Contact Support — we're here to help.


